-
Description
Link design, while relatively easy in the past, can become quite cumbersome with complex channel plans and equipment configurations. The task of designing optical transport systems and selecting equipment is often performed by an applications or sales engineer. Design tools, such as custom Excel spreadsheets, are often used in this process. Eventually every individual has their own version of the spreadsheet and also their own methodology for building the network being quoted. This approach becomes unmanageable very quickly and leads to mistakes, bending of the engineering rules, misquotes and installations that do not perform as expected. For the sales team this can be a disaster. VPIlinkConfigurator offers an efficient approach to unify, control and expedite the quoting process by controlling libraries of equipment and engineering methodologies, automating the design process and providing the analysis tools necessary to predict system performance throughout the system and for all channels.
-
Typical Results
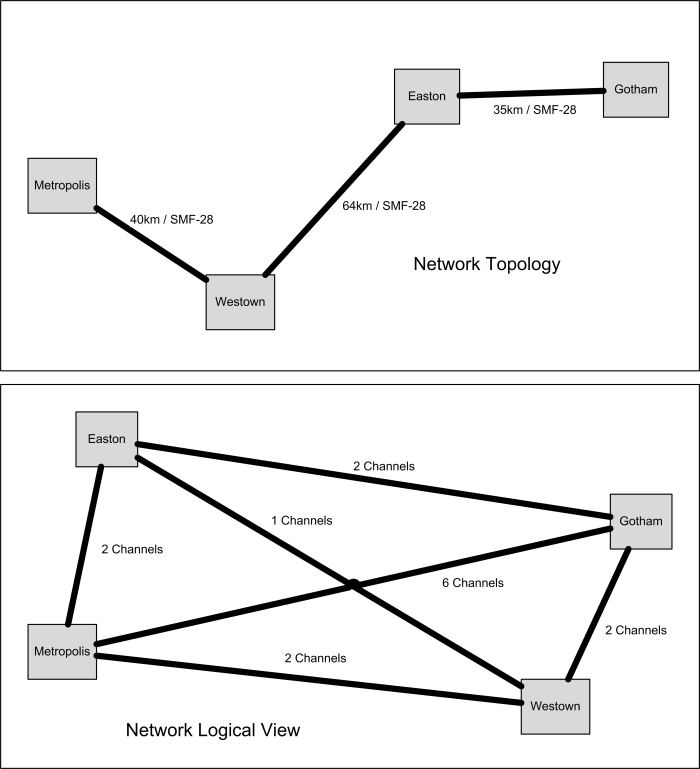
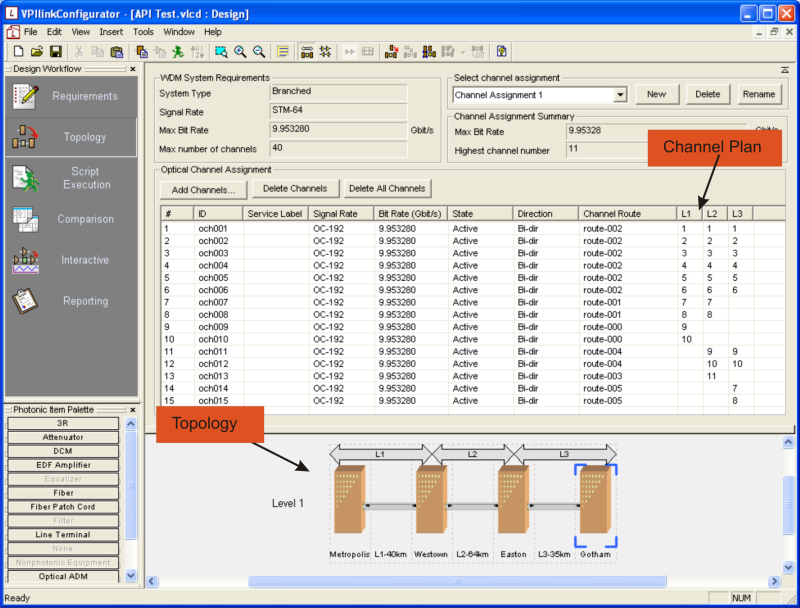
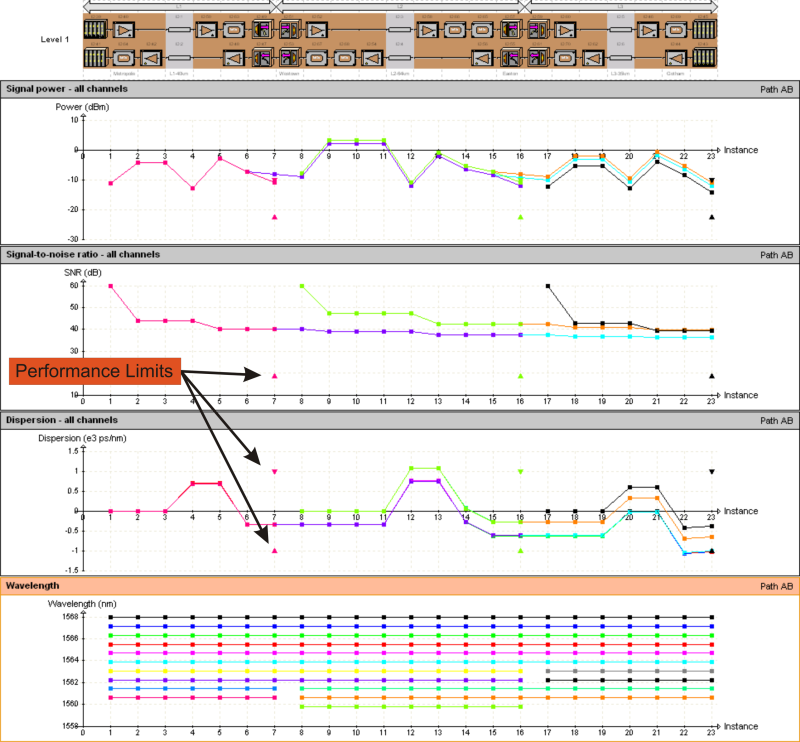
An example of a relatively simple linear network is shown in . In this figure, both the topological and logical views are shown. From this drawing, the nodes and fiber routes can be established in LinkConfigurator. Channel plans can easily be derived from the logical view in and also input into LinkConfigurator as shown in . Once the topology and channel plan are established, items may then be taken from a set library of equipment and placed in the nodes. The complication here is that the placement of amplifiers, attenuators and dispersion-compensating elements has to be done to keep the link performance, for instance, optical powers, accumulated dispersion and OSNR, for example, within the equipment capability. This equipment placement can be performed manually or in an automated fashion through the use of Visual Basic or Python scripts. These scripts can be written to take into account both link performance and cost in the optimization process. shows the results of the script-driven equipment placement process. In addition, it shows a set of plots of system performance metrics as maps. Using these maps the designer can see the evolution of each wavelength as it propagates through the system. At critical points in the maps, any limitations such as received power minimum and maximum or OSNR minimum are shown.
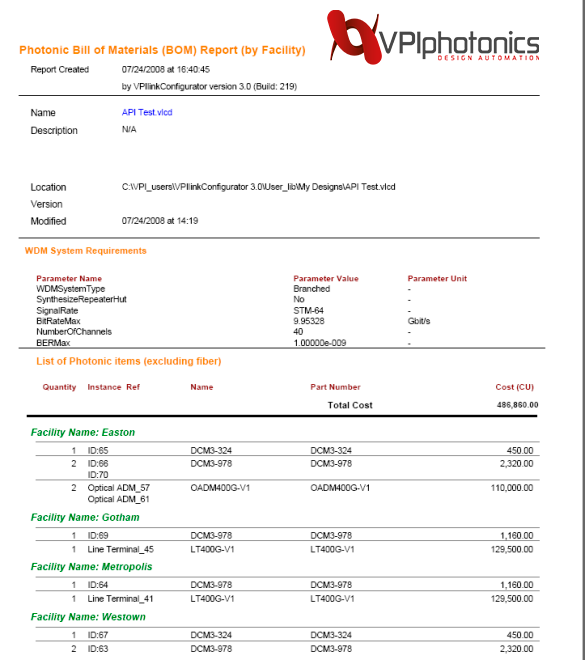
Finally, reports such as system performance or a Bill of Materials can be generated, as shown in
-
Further Information
Keywords: Link Design, Automation, Equipment Placement, System Performance Maps, Cost-optimized Configuration, Bill of Materials, DWDM Transmission Line
Similar demonstrations are available in the VPIlinkConfigurator Examples section.